

CryoSat2 - Model Comparison at Vatnajökull Ice Cap, Iceland#
This notebook was created at the beginning of the DTC Glaciers project for illustration of the scientific challenges to be tackled. We compare the output from the Open Global Glacier Model (OGGM) v1.6.1 against EO And in-situ observations at Vatnajökull ice cap, Iceland.
from oggm import utils, workflow, tasks, DEFAULT_BASE_URL, cfg
import yaml
import geopandas as gpd
import pandas as pd
import numpy as np
import matplotlib.pyplot as plt
import seaborn as sns
import matplotlib.dates as mdates

sns.set_style("whitegrid")
sns.set_context("notebook")
# Where to find the test files on EODS
dtcg_url = (
    "https://cluster.klima.uni-bremen.de/~dtcg/test_files/case_study_regions/iceland/"
)
# OGGM parameters
cfg.initialize(logging_level="ERROR")
cfg.PARAMS["use_multiprocessing"] = True
cfg.PARAMS["continue_on_error"] = True
cfg.PATHS["working_dir"] = utils.get_temp_dir("working_dir")
2026-02-24 16:47:28: oggm.cfg: Reading default parameters from the OGGM `params.cfg` configuration file.
2026-02-24 16:47:28: oggm.cfg: Multiprocessing switched OFF according to the parameter file.
2026-02-24 16:47:28: oggm.cfg: Multiprocessing: using all available processors (N=4)
2026-02-24 16:47:28: oggm.cfg: Multiprocessing switched ON after user settings.
2026-02-24 16:47:28: oggm.cfg: PARAMS['continue_on_error'] changed from `False` to `True`.
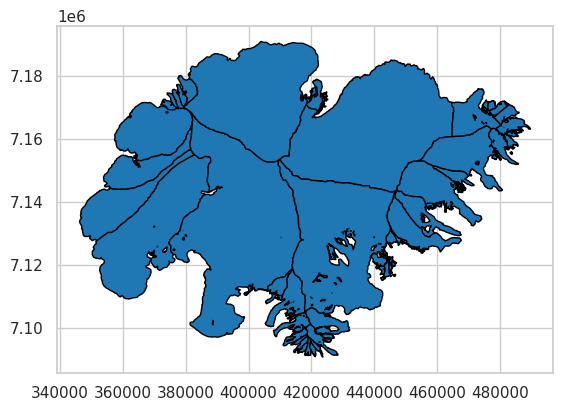
Load Vatnajökull RGI6 outlines#
# RGI6 ids
with open(
    utils.file_downloader(dtcg_url + "vatnajokull_rgi_ids.yml"), "r"
) as yaml_file:
    rgi_ids = yaml.safe_load(yaml_file)["rgi_ids"]

# Select the outlines from RGI6 file and convert to UTM
rgi_file = gpd.read_file(utils.get_rgi_region_file("06"))
rgi_file = rgi_file.loc[rgi_file.RGIId.isin(rgi_ids)].set_index("RGIId")
rgi_file = rgi_file.to_crs("EPSG:32628")
rgi_file.plot(ec="k");
Fetch the standard global OGGM runs#
gdirs = workflow.init_glacier_directories(
    rgi_ids,  # which glaciers?
    prepro_base_url=DEFAULT_BASE_URL,  # where to fetch the data?
    from_prepro_level=4,  # what kind of data?
    prepro_border=80,  # how big of a map?
)
Re-run OGGM at monthly timestep and load data#
workflow.execute_entity_task(
    tasks.run_from_climate_data,
    gdirs,
    init_model_filesuffix="_spinup_historical",
    init_model_yr=1979,
    store_monthly_step=True,
    ys=1979,
    ye=2020,
    mb_elev_feedback="monthly",
    output_filesuffix="_spinup_historical_monthly",
)

ds_monthly = utils.compile_run_output(
    gdirs, input_filesuffix="_spinup_historical_monthly"
)
2026-02-24 16:47:50: oggm.workflow: Execute entity tasks [run_from_climate_data] on 118 glaciers
2026-02-24 16:47:53: oggm.core.flowline: AttributeError occurred during task run_from_climate_data_spinup_historical_monthly on RGI60-06.00387: 'Dataset' object has no attribute 'time'
2026-02-24 16:48:12: oggm.utils: Applying global task compile_run_output on 118 glaciers
2026-02-24 16:48:12: oggm.utils: Applying compile_run_output on 118 gdirs.
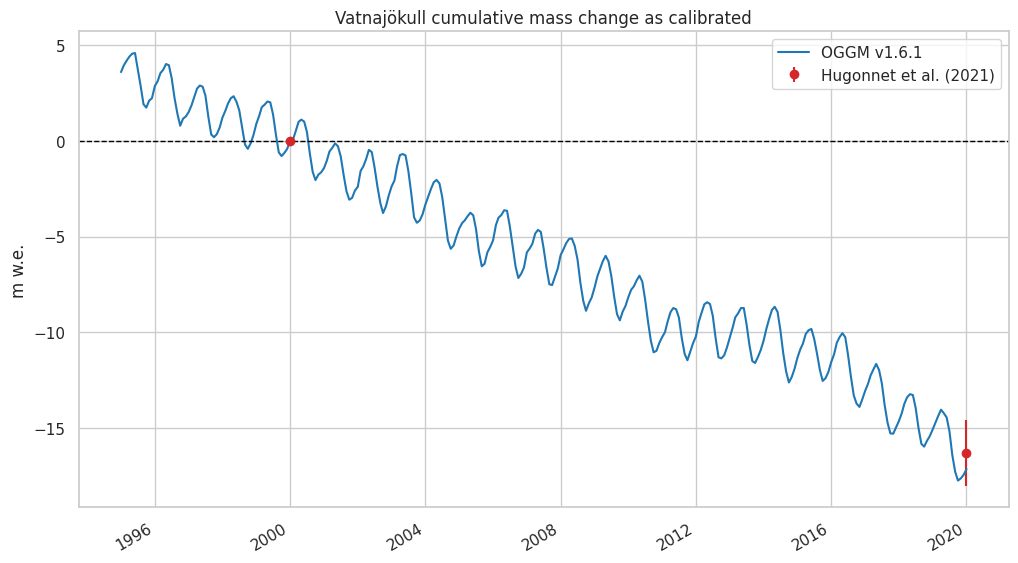
Modelled mass change and comparison to calibration data#
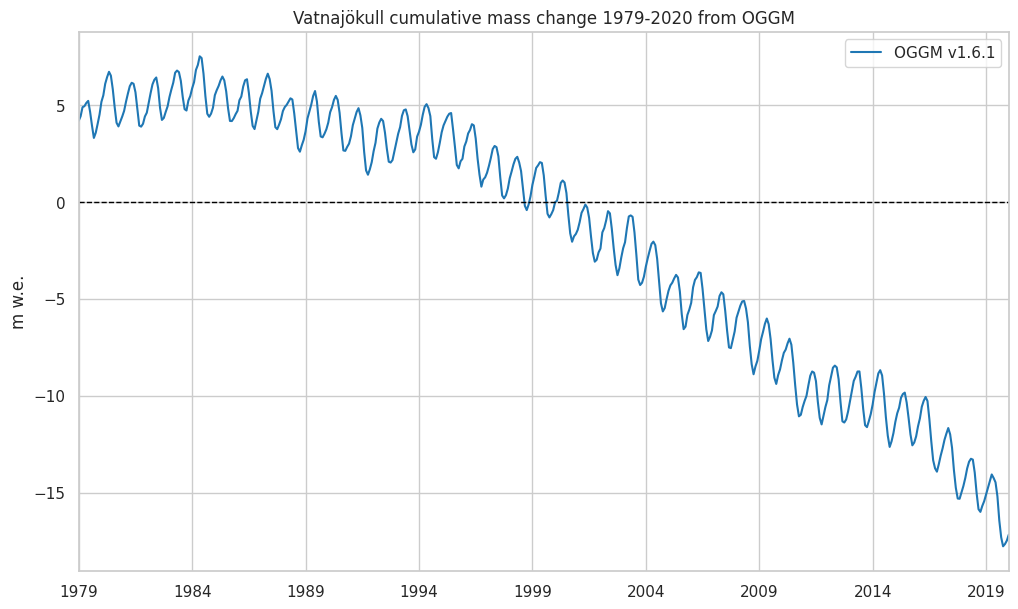
OGGM#
years, months = utils.floatyear_to_date(ds_monthly.time)
df = pd.DataFrame(index=pd.to_datetime({"year": years, "month": months, "day": 1}))
df["OGGM_volume_m3"] = ds_monthly.sum(dim="rgi_id").volume.data
df["OGGM_mwe"] = (
    (df["OGGM_volume_m3"] - df["OGGM_volume_m3"].loc["2000-01"].values)
    / (rgi_file.Area.sum() * 1e6)
    * 900
    / 1000
)
f, ax = plt.subplots(figsize=(12, 7))
df["OGGM_mwe"].plot(ax=ax, label="OGGM v1.6.1")
ax.axhline(0, linestyle="--", color="black", linewidth=1)
plt.ylabel("m w.e.")
plt.title("Vatnajökull cumulative mass change 1979-2020 from OGGM")
plt.legend();
Hugonnet observations#
ref_mb_df = utils.get_geodetic_mb_dataframe().loc[rgi_ids]
ref_mb_df = ref_mb_df.loc[ref_mb_df.period == "2000-01-01_2020-01-01"]
hugonnet_20yrs = (
    (ref_mb_df["area"] * ref_mb_df["dmdtda"]).sum() / ref_mb_df["area"].sum() * 20
)
hugonnet_20yrs_err = (
    (ref_mb_df["area"] * ref_mb_df["err_dmdtda"]).sum() / ref_mb_df["area"].sum() * 20
)
# Compute Hugonnet's mass balance estimates for the plot
p0 = df["OGGM_mwe"].loc["2000-01"].iloc[0]
p1 = hugonnet_20yrs + p0

f, ax = plt.subplots(figsize=(12, 7))
ptimes = df.loc[["2000-01", "2020-01"]].index
ax.errorbar(
    x=ptimes,
    y=[p0, p1],
    yerr=[0, hugonnet_20yrs_err],
    fmt="o",
    color="C3",
    label="Hugonnet et al. (2021)",
)
df["OGGM_mwe"].loc["1995":].plot(ax=ax, label="OGGM v1.6.1")
ax.axhline(0, linestyle="--", color="black", linewidth=1)
plt.ylabel("m w.e.")
plt.title("Vatnajökull cumulative mass change as calibrated")
plt.legend();
/opt/hostedtoolcache/Python/3.11.14/x64/lib/python3.11/site-packages/pandas/plotting/_matplotlib/core.py:997: UserWarning: This axis already has a converter set and is updating to a potentially incompatible converter
  return ax.plot(*args, **kwds)
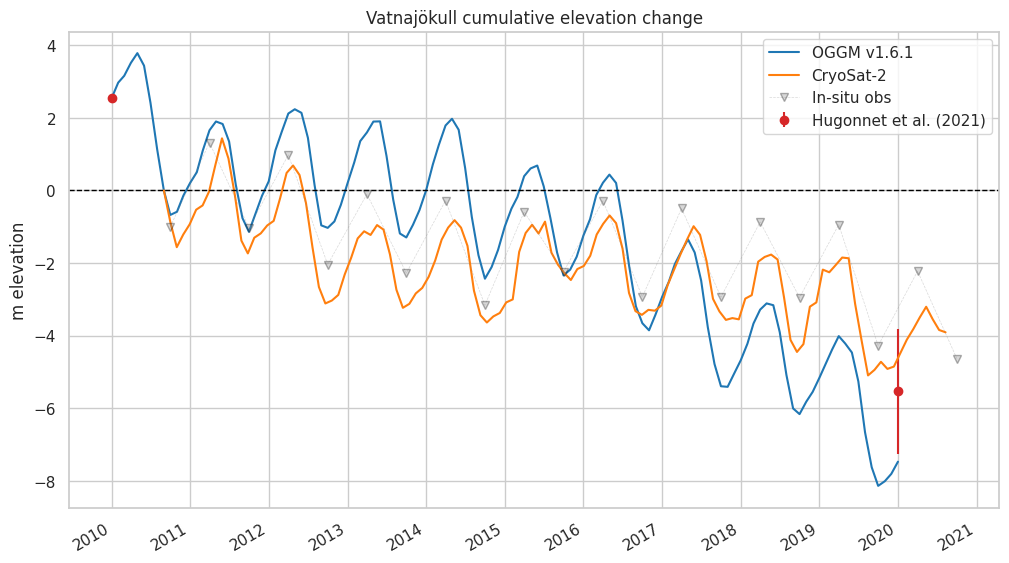
Elevation change comparison#
Load Cryosat-2 data#
obs_file = utils.file_downloader(dtcg_url + "averaged_grid.csv")
df_obs_elev = pd.read_csv(obs_file, index_col=1, parse_dates=True)
df_obs_elev = df_obs_elev[
    "changes_t0"
]  # only keep average which is used for comparision
Hugonnet et al#
ref_mb_df = utils.get_geodetic_mb_dataframe().loc[rgi_ids]
ref_mb_df = ref_mb_df.loc[ref_mb_df.period == "2010-01-01_2020-01-01"]
# Hugonnet uses 850
hugonnet_10yrs = (
    (ref_mb_df["area"] * ref_mb_df["dmdtda"]).sum()
    / ref_mb_df["area"].sum()
    * 10
    * 1000
    / 850
)
hugonnet_10yrs_err = (
    (ref_mb_df["area"] * ref_mb_df["err_dmdtda"]).sum()
    / ref_mb_df["area"].sum()
    * 10
    * 1000
    / 850
)
WGMS#
dfw = pd.read_csv(utils.file_downloader(dtcg_url + "vatna_berthier.csv"), index_col=0)

dfwts = pd.DataFrame()

for y, d in dfw.iterrows():
    dfwts.loc[pd.Timestamp(year=y, month=4, day=1), "MB"] = d.bw
    dfwts.loc[pd.Timestamp(year=y, month=10, day=1), "MB"] = d.bs
    pass

dfwts["MB_m"] = dfwts["MB"] * 1000 / 850
dfwts["MB_m_cum"] = dfwts["MB_m"].cumsum()
Compute modelled elevation change#
# it is a bit unclear which basline was used by the observations
# from the meta_data: "average of the first 5 months (all data pre-2011)"
# baseline_volume = np.mean(volume_total.sel(time=slice(2011, 2011.5)))
# Her we just pick the first one in the obs timeseries
baseline_volume = df["OGGM_volume_m3"].loc["2010-09"].values

# divide by RGI area, which is the same area as used by the creation of the observation
rgi_area = np.sum([gdir.rgi_area_m2 for gdir in gdirs])

# finally the calculation of the modelled elevation change
# This assumes a density of 900 kg m2
df["OGGM_elev"] = (df["OGGM_volume_m3"] - baseline_volume) / rgi_area
Plot elevation change observed vs. modelled#
# Compute Hugonnet's mass balance estimates for the plot
p0 = df["OGGM_elev"].loc["2010-01"].iloc[0]
p1 = hugonnet_10yrs + p0

f, ax = plt.subplots(figsize=(12, 7))
ptimes = df.loc[["2010-01", "2020-01"]].index
ax.errorbar(
    x=ptimes,
    y=[p0, p1],
    yerr=[0, hugonnet_20yrs_err],
    fmt="o",
    color="C3",
    label="Hugonnet et al. (2021)",
)
df["OGGM_elev"].loc["2010":].plot(ax=ax, label="OGGM v1.6.1")
df_obs_elev.plot(ax=ax, label="CryoSat-2")

wgts = (dfwts["MB_m_cum"] - dfwts["MB_m_cum"].loc["2010-10-01"] - 1).loc["2010-10-01":]
wgts.plot(
    ax=ax,
    linestyle="--",
    color="grey",
    linewidth=0.5,
    alpha=0.3,
    marker="v",
    markersize=6,
    markerfacecolor="grey",
    markeredgecolor="k",
    label="In-situ obs",
)
ax.axhline(0, linestyle="--", color="black", linewidth=1)

# Set x-axis ticks to show every year
ax.xaxis.set_major_locator(mdates.YearLocator())  # One tick per year
ax.xaxis.set_major_formatter(mdates.DateFormatter("%Y"))  # Format as "YYYY"

plt.xlabel("")
plt.ylabel("m elevation")
plt.title("Vatnajökull cumulative elevation change")
plt.legend();
/opt/hostedtoolcache/Python/3.11.14/x64/lib/python3.11/site-packages/pandas/plotting/_matplotlib/core.py:997: UserWarning: This axis already has a converter set and is updating to a potentially incompatible converter
  return ax.plot(*args, **kwds)
WGMS comparison#
Load WGMS data#
fp_wgms = utils.file_downloader(dtcg_url + "WGMS_MB-DTC-Glaciers.csv")
wgms_data = pd.read_csv(fp_wgms)
Helper functions to access WGMS data
# conversions between wgms ids and rgi ids
fp_wgms_ids_conversion = utils.file_downloader(dtcg_url + "glacier_id_lut.csv")
df_wgms_ids = pd.read_csv(fp_wgms_ids_conversion)


def get_wgms_from_rgi(rgi_id):
    if rgi_id in df_wgms_ids["RGI60_ID"].values:
        return df_wgms_ids[df_wgms_ids["RGI60_ID"] == rgi_id]["WGMS_ID"].item()
    else:
        return None


def get_rgi_from_wgms(wgms_id):
    if wgms_id in df_wgms_ids["WGMS_ID"].values:
        return df_wgms_ids[df_wgms_ids["WGMS_ID"] == wgms_id]["RGI60_ID"].item()
    else:
        return None
def get_wgms_mb_observation(rgi_id):
    """
    Returns (mb_DataFrame, Glacier name)
    """
    wgms_id = get_wgms_from_rgi(rgi_id)

    # only not None if this glacier is a WGMS glacier
    if wgms_id:
        # check if we have some data
        if wgms_id in wgms_data["glacier_id"].values:
            wgms_glacier_data = wgms_data[wgms_data["glacier_id"] == wgms_id]
            df_wgms_glacier_data = pd.DataFrame(
                {"annual_balance": wgms_glacier_data["annual_balance"].values},
                index=wgms_glacier_data["year"].values,
            )
            return (
                df_wgms_glacier_data,
                wgms_glacier_data["glacier_id.short_name"].values[0],
            )
Compute hydro year averages#
# Here we need some code to work in hydro ye
df_annual = pd.DataFrame()
for y in range(1980, 2019):
    d0 = f"{y-1}-10-01"
    d1 = f"{y}-10-01"
    df_annual.loc[y, "OGGM_mwe"] = df.loc[d1]["OGGM_mwe"] - df.loc[d0]["OGGM_mwe"]
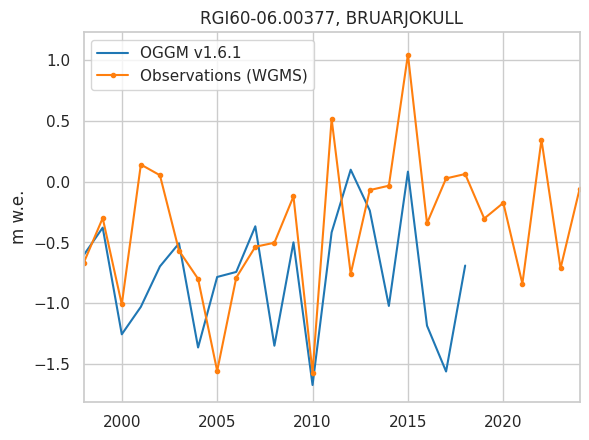
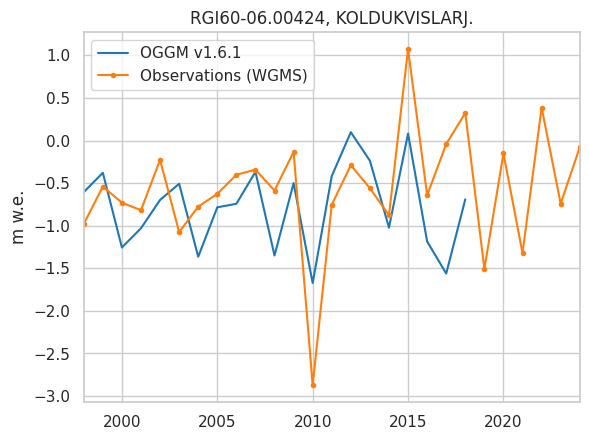
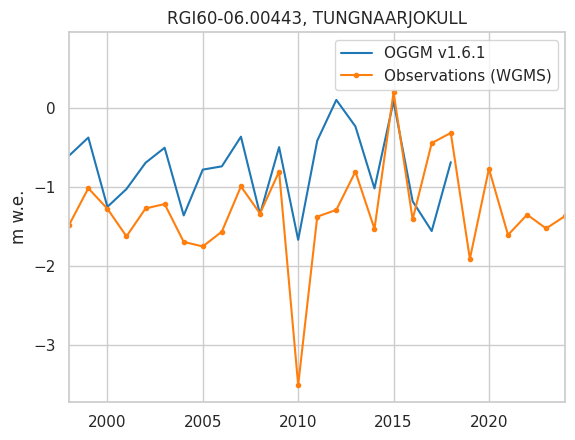
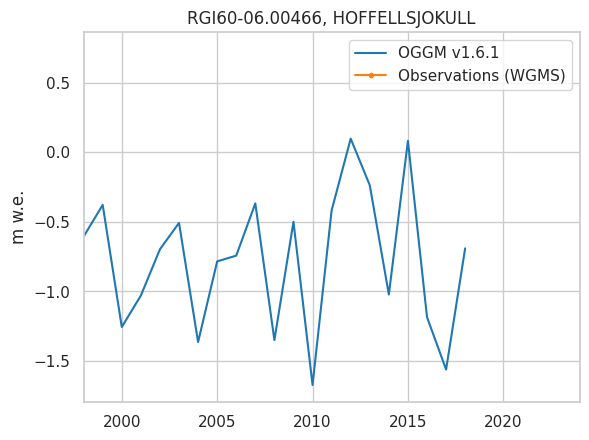
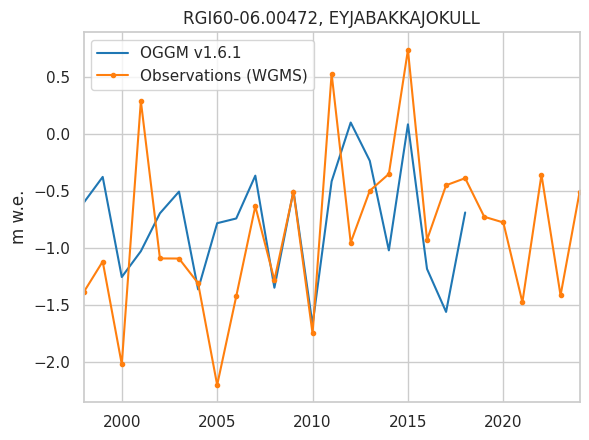
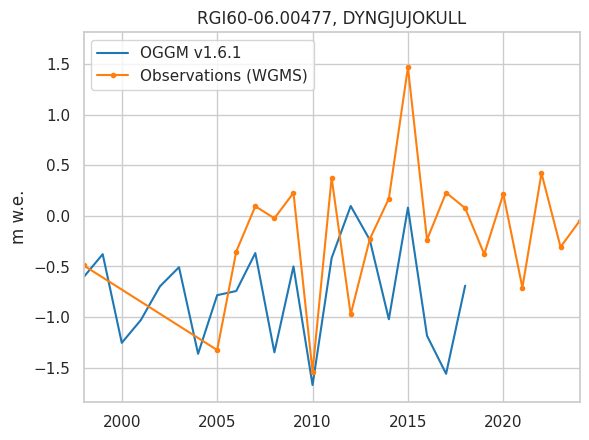
Plot WGMS and modelled mb for all available glaciers#
for gdir in gdirs:
    wgms_mb = get_wgms_mb_observation(gdir.rgi_id)
    if wgms_mb is not None:
        fig, ax = plt.subplots(1, 1)
        # add modelled smb
        df_annual["OGGM_mwe"].plot(ax=ax, label="OGGM v1.6.1")
        # add observation
        wgms_mb[0]["annual_balance"].plot(
            ax=ax, marker=".", label="Observations (WGMS)"
        )
        ax.set_title(f"{gdir.rgi_id}, {wgms_mb[1]}")
        ax.set_xlabel("")
        ax.set_ylabel("m w.e.")
        ax.legend()
        ax.set_xlim(1998, 2024)
        plt.show()